Table of contents
New to Powell Intranet? Click here for the full product overview.
Introduction
The Power BI web part is a Powell 365 web part and an example of it can be found on the Powell Intranet "Sales" page.
You can share company KPIs via Power BI display tiles!
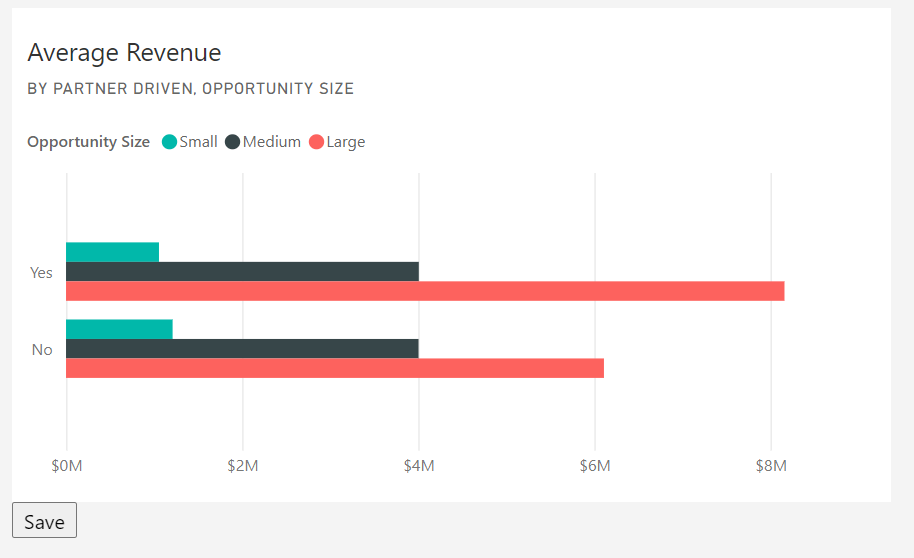
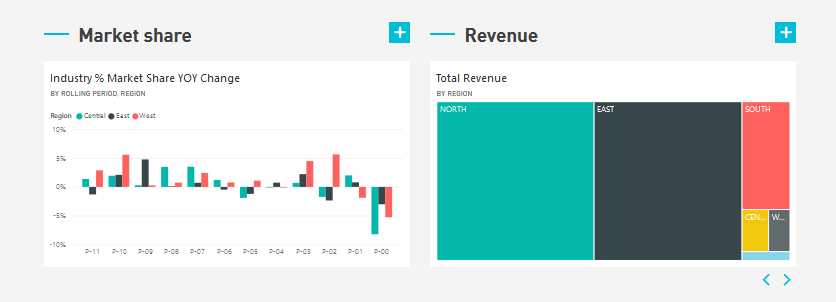
This widget selects a Power BI dashboard & a specific tile to share responsive design graphs! Via a single sign-in connection can have secure access based on roles.
Via the Power BI application, you will see one report readily available. As Powell 365 can offer an array of reports that can be readily available via Power BI. These set of reports can be configured the way you want, to match your specific needs.
The Power BI reports display metrics that come from Google Analytics.
Power BI web part on the "Sales" page
Settings
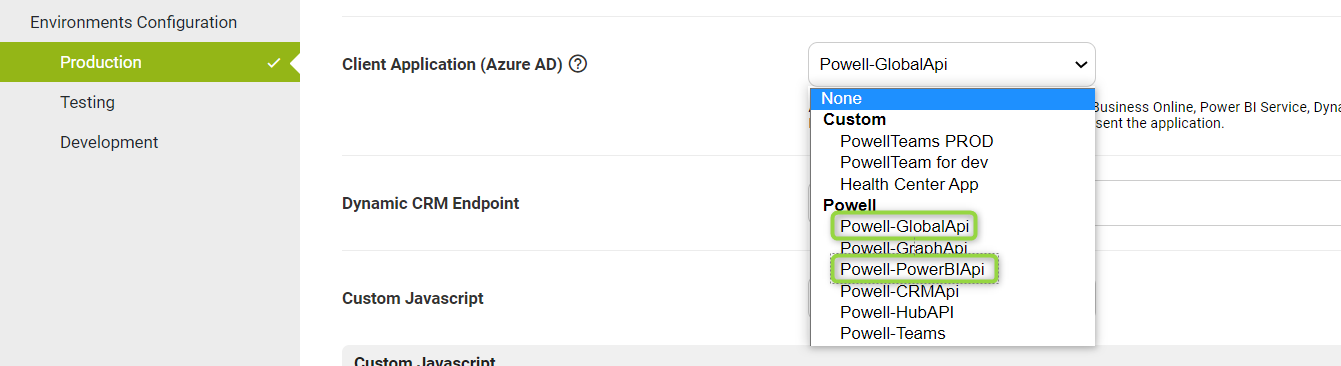
First of all, to use this component, you need to consent to the Power BI API and select it in the site collection configuration, where you want to deploy the web part.
You can select "Powell-GlobalAPI" or "Powell-PowerBIApi."
Then, all the configuration needs to be done directly from the portal. That means, from Powell manager, you can only define where you want to place the web part and its title.
Once your web part is deployed on your portal, you need to edit your page to access the properties of the web part and be able to change it :
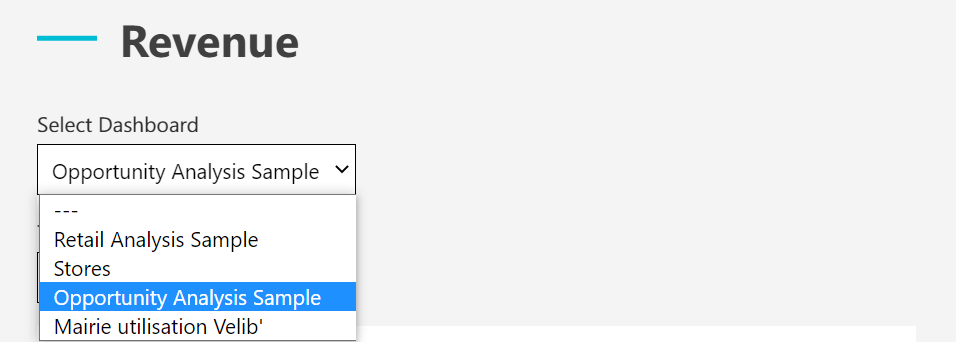
You can choose the Dashboard's name you want to display (only shared reports are shown here).
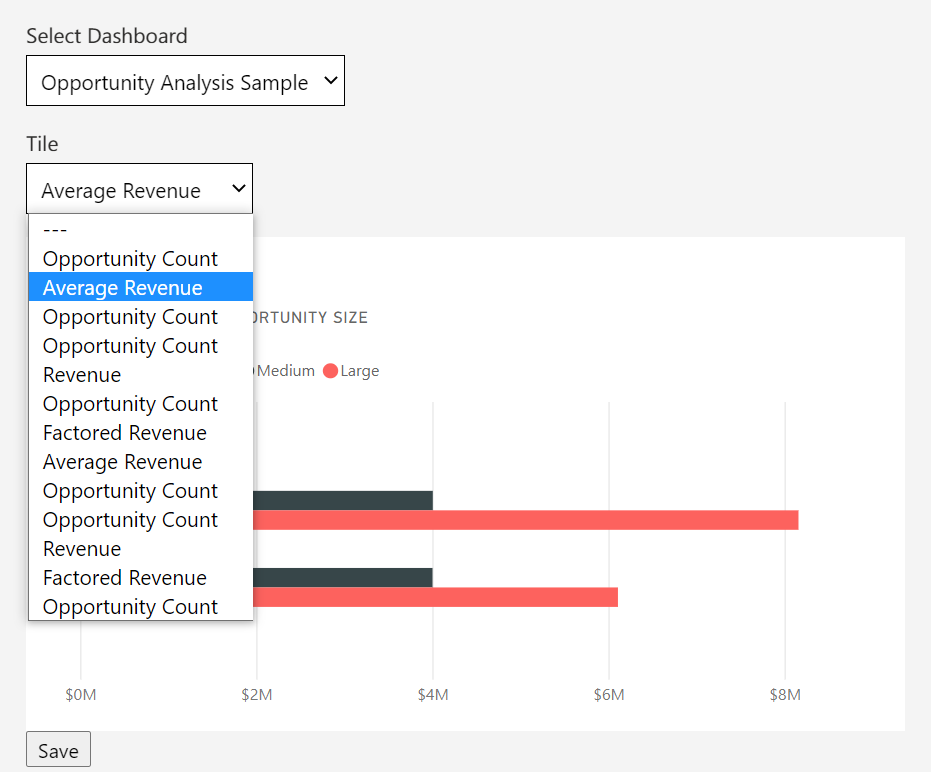
If your report contains more than one tab, you can select the one you have in the list.
Each time you select another board, you can see a preview below.
When you are satisfied, click on Save and Publish your page.